Advanced Settings - Define Contents
In this settings window you define which contents of your map should be available in easymap explorer. For example, you can configure the initial default view when calling the workbook or select a background map.
Hint: Please note that some of the settings are only valid for easymap explorer and others are also applied directly in easymap office. The settings that are applied to the workbook are marked separately. The changes that are applied to the workbook are marked with ¹.
In this settings window, you define which contents of your map are displayed in the easymap explorer should be available. For example, you can configure the initial when calling the workbook or select one.
Structure of the Settings Window
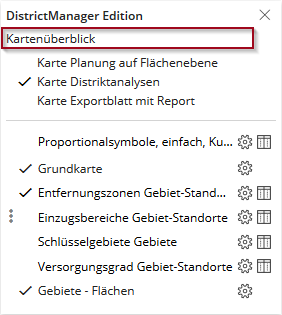
In the left part of the settings window you can see the contents of the easymap office-workbook, structured and summarised according to the view in the easymap explorer. The map layers are marked differently for you depending on availability:

|
level is in the easymap explorer available and already visible when opening the map. |

|
level is in the easymap explorer available, initially invisible when opened, but can be easymap explorer can be switched to visible. |

|
level is in the easymap explorer not available. If the font for these layers is displayed in grey, you cannot change the availability (e.g. for PTV maps or for area layers without coloured areas). |

|
If a layer has additional sub-elements (as in the case of the base map, for example), an arrow pointing to the right is displayed, which lists all sub-elements by expanding it. If legends have been inserted for an analysis, the legend subelement is listed. |
After selecting an element, you can adjust various settings for display, label or filter on the right page of the window.

You can use the toolbar to control the following actions:

|
Expand the view. |

|
Reduce the view. |

|
Move one layer up. |

|
Move one layer down. |
Commands in the context menu
In the table of contents on the left, you can call context menu commands on individual levels.
Changing the order of maps and layers
For single layers and maps you can change the display order with the commands Layer down and Layer up or also add a layer to the base map. If the layer is added to the base map, it can no longer be made visible or invisible separately in the explorer. Layers below the base map can be removed from this group with the context menu command remove from base map and can be used as a separate layer in the content of the map, with all setting options like other layers.
Transfer settings
Would you like to transfer individual settings directly to several analyses or to all maps?
On the right side, you can transfer the settings of individual properties to other layers using the context menu command Transfer to.... To do this, select the appropriate setting, e.g. available = Yes, and then click Transfer. Another window will open, in which you can select the layers to which you want to transfer the setting.
The settings of the different map layers
| Designation |
Enter the desired name for the area heading Maps in the window Content. |
| Standard view |
If you have several sheets and maps, you can specify here which map is to be displayed first (open). |
| Control window |
Here you have various options for selecting the EasyMap Xplorer control window. The first time you call up the map, the selected window is displayed open, or you can prevent a window from opening or make the menu completely invisible. Choose here between:
|
| Search mode |
Select here which search mode you want to set for your map.
For more information on the different modes here. |
| Local path |
Shows you where in which directory the workbook was saved. |
| General | |
| ¹ Designation | Here you can change the name of the map. The name of the map is displayed easymap explorer under the workbook title as well as in the content control window, if several maps are available in the folder. |
| Available |
Select here whether the selected element in the(fehlender oder ungültiger Codeausschnitt) should be available. |
| Infinite World | Infinite World = Yes means that the map always repeats itself when moved, similar to a globe. |
| ¹ Background color |
Select a background color for the map here. Please note that this colour will also appear in your workbook immediately after your choice. |
| copyright |
Enter the copyright information for your map here. In addition to your entry, the following copyright appears: © by infas LT If a background map such as Bing Maps is inserted, the copyright notice of the background map also appears. |
| Print map |
Here you can switch the print function on and off and decide whether the icon should appear in the hamburger menu or next to the magnifying glass. |
| Start Zoom | Here you can set which section the map should display when opened. You can select already integrated maps and print areas. |
| Map title | |
| Display |
You have four options for displaying the map title:
|
| logo |
In addition to the map title, you can optionally select a logo to be displayed. easymap explorer anzeigen zu lassen. |
| Text color / Background color / Opacity in % | Define an individual font color, background color or opacity for the entire map title field here. It makes sense to set a transparency so that the map content behind it is not completely covered. |
| Settings | |
| Layers moveable | Set here for the respective map whether the map layers in the content can be moved in their drawing order by drag & drop. |
| Zoom level | |
| Visible from / to zoom level |
Here you can set the zoom level, from and to where the map is visible. This allows you to prevent zooming too far into or out of the map. The zoom levels are fixed levels from 0 - 19, based on the widely used online map services in WebMercator projection. |
| Designation | Enter the desired designation for the group easymap explorer or enter nothing if you do not want the content area to have a heading. |
| General | |
| ¹ Designation | (fehlender oder ungültiger Codeausschnitt) |
| Available | (fehlender oder ungültiger Codeausschnitt) |
| Visible in the control window | Here you can specify whether this analysis is visible in the table of contents, regardless of the visibility in the map. Note that this layer cannot then be made invisible in the map. |
| Visible | Select here whether the selected analysis easymap explorer should be visible. |
| Scale range | Here you can find out whether a scale range has been set up in easymap office for the analysis. According to this setting the analysis is also easymap explorer displayed. This setting can only be changed in easymap office. |
| ¹ Mutual visibility group | Enter a group name for the layers which are to be switched visible alternately. Existing visibility groups from easymap office-workbook are taken over. |
| ¹ Simultaneous visibility group |
Geben Sie für die Ebenen, die gleichzeitig sichtbar und unsichtbar geschaltet werden sollen, eine Gruppenbezeichnung ein. Bestehende Sichtbarkeitsgruppen aus der easymap-Kartenmappe werden übernommen. |
| Settings | |
| Adjustable opacity | (fehlender oder ungültiger Codeausschnitt) |
| Opacity in % | (fehlender oder ungültiger Codeausschnitt) |
| ¹ Designation |
Enter the desired name here. Please note that the name you enter here also appears in the workbook. |
| Available |
Select here whether the selected element in the(fehlender oder ungültiger Codeausschnitt) should be available. |
| Display |
Set here where you want to display the legends. You have the following choices:
|
| Show heading |
Select whether the legend level name is to be displayed. Hint: Please note that this setting is not available for selection when the legends are displayed in the Contents window. |
| Font color |
Define individual font color for the legend element here. Hint: Please note that this setting is not available for selection when the legends are displayed in the Contents window. |
| Background color |
Define individual background color for the legend element here. Hint: Please note that this setting is not available for selection when the legends are displayed in the Contents window. |
| Opacity in % |
Define an individual opacity for the legend element here. A set transparency / opacity is useful in order to not completely cover the map content behind it. Hint: Please note that this setting is not available for selection when the legends are displayed in the Contents window. |
| ¹ Designation | Enter the desired name for the basic map group here. |
| Available |
Select here whether the selected element in the(fehlender oder ungültiger Codeausschnitt) should be available. |
| Visible | Here you can set whether the base map - with all available sub-elements - should also be visible. |
| Visible in the control window | Here you can specify whether the base map is visible in the table of contents, regardless of the visibility in the map. Note that this layer cannot then be made invisible in the map. |
| Adjustable opacity |
Here you can define whether the transparency of the map layer or analysis may be changed and whether an output opacity in percent may be preset, e.g. to let a background map shine through. |
| Opacity in % |
Set the opacity value in percent here. |
| ¹ Designation |
Enter the desired name here. Please note that the name you enter here also appears in the workbook. |
| Available |
Select here whether the selected element in the(fehlender oder ungültiger Codeausschnitt) should be available. |
| Visible | The subelements of the base map cannot be switched separately visible or invisible. This setting can only be changed in easymap office. |
| Scale range |
Here you can find out whether a scale range has been set up for the element in easymap office. According to this setting the element is also displayed in the(fehlender oder ungültiger Codeausschnitt) displayed. This setting can only be changed in easymap office. |
| Designation | |
| Road map | Here you can create a street map for display in the easymap explorer select. Once a map is selected, the following setting options are available. |
| Card style Initial |
Select here which map style should be used when opening the map for the first time in the easymap explorer You can choose from the following settings:
|
| Visible in the control window | Here you can specify whether the base map is visible in the table of contents, regardless of the visibility in the map. Note that this layer cannot then be made invisible in the map. |
| Search | |
| Search | Here you can set whether the background map can also be used when searching. |
| Search result shows | |
| Zoom level | |
| Visible from zoom level | Select here from which zoom level the background map in the easymap explorer should be visible. |
| Visible up to zoom level | Select here the zoom level up to which the background map in the easymap explorer should be visible. |
| ¹ Designation | (fehlender oder ungültiger Codeausschnitt) |
| Control level | Displays the controlling level of the area report. This specification cannot be changed. |
| Available | (fehlender oder ungültiger Codeausschnitt) |
| Permission set | Select the authorization set that controls access to the report. If no access rules have yet been created, you can create a new authorization set here. With (no access restriction) anyone can view the report pages. |
| Authorizations | Gives you the ability to customize permissions for registered users. You will be redirected directly to your explorer profile when you click on , where you can regulate report access and make necessary changes. |
Data display on the map and in tables
In the easymap explorer you can display data on territory layers via context-sensitive tooltips in the map. In analysis outputs and area layers, you can define exactly what should be displayed when clicking on a location in the map. You also have the option of displaying tables for each analysis or territory layer below the map, as well as allowing the export of data.
To configure the table and data displays, first select the desired level in the left area of the settings window.
| Table selection |
You only have the option of table selection for layers from the territory structure - here you can choose between geography tables and territory work tables. |
| ¹ Table designation | Here you can rename the name of the table used for the analysis or surface plane. |
| Column settings |
After clicking Edit Column Settings... you can make various settings regarding display, search and filter options of analyses and territory structures. The data columns of the table on which the selected analysis is based are displayed. Columns can be renamed for display in the easymap explorer or by setting or removing check marks, the display, search and filter options can be restricted via individual columns. You can also insert separator rows and separator lines for a clearer layout of the data display. You can select multiple rows by holding down Ctrl to change their settings at the same time, e.g. to set or remove checkmarks or to change the order of the columns. |
| Column alignment | Here you can set whether the data should be displayed left- or right-justified or automatically adjusted in the tooltip. |
| Allow table display | Set here whether in the easymap explorer the table may be displayed. |
| Allow export | Set here whether the export of the data in the easymap explorer may be allowed. |
|
Data display
|
Here you can set whether and with which user interaction the data should be displayed in the explorer. You can suppress the data display with the None option, or display on click first, or directly on mouse over, i.e. when hovering over the map with the mouse. The behavior when clicking in the area can still be varied: click (highlighted) changes the mouse pointer to a hand symbol to emphasize that a data display is possible at this point. With click (opens link) a link defined by you will be opened. The prerequisite for this option is that there is a Href column and a Target column in the table base. These columns must be selected here. |
| ¹ Allow search |
Set here whether within the analysis or the area level in the easymap explorer may be sought. The address search option is only available if you activate the Bing Maps street map as the background map. You can easily purchase a Microsoft Bing Maps license when ordering the easymap explorer optionally book with. |
| Search shows |
With the Search result option, only the result in the data window that is also clicked in the search results is displayed in the map. The Data Display at Position option simulates the Data Display at Click on the map. If you click here on a specific search result, the data window in the map shows not only the clicked result, but also the objects that are in the immediate vicinity. You can then switch between the entries in the lower area of the data window. 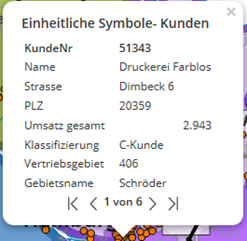
Example Data display at position: When searching for data in a customer table, you enter "Bonn" as the search term. In the search result all customers are listed, where "Bonn" is available in the selected column. If you now click on a search result, the map will show you further customers in the opened data window. These are all located in the immediate vicinity of the selected customer. |
| ¹ Allow filter | Set here whether within the analysis in the easymap explorer may be filtered. |
| Filter mode |
Enhanced - in this mode the functions remove filter from map, apply filter to map and restore map filter are available in the table view - switching to simple filter mode is not possible in the easymap explorer possible. Simply - in simple mode, filters in the table are applied directly to the corresponding analyses in the map view - switching to advanced filter mode is not possible in the easymap explorer possible. Simply forced - it is not possible to switch from the simple filter mode to the extended mode. |
Additional functions
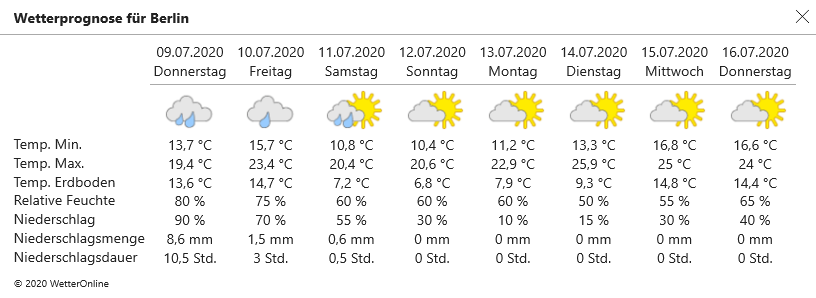
Weather data are provided by Weather Online via Infas360.
Hint: This feature is only available if you have purchased the easymap explorer pro extension. For more information, contact us.
Pro features
This analysis allows you to display isolines around a territory location, an area or all available location-based analyses on the map directly in the browser. You specify the radius of the isoline in kilometers or minutes. This analysis is useful, for example, to display "theoretical" or "ideal" catchment areas of sites and thus contrast them with the actual catchment areas or areas of responsibility.
You can activate this function when sharing in the advanced settings of the map in the submenu Additional functions. By clicking on Available functions you open the dialog for the additional functions. Click on the box to activate or deactivate the function.
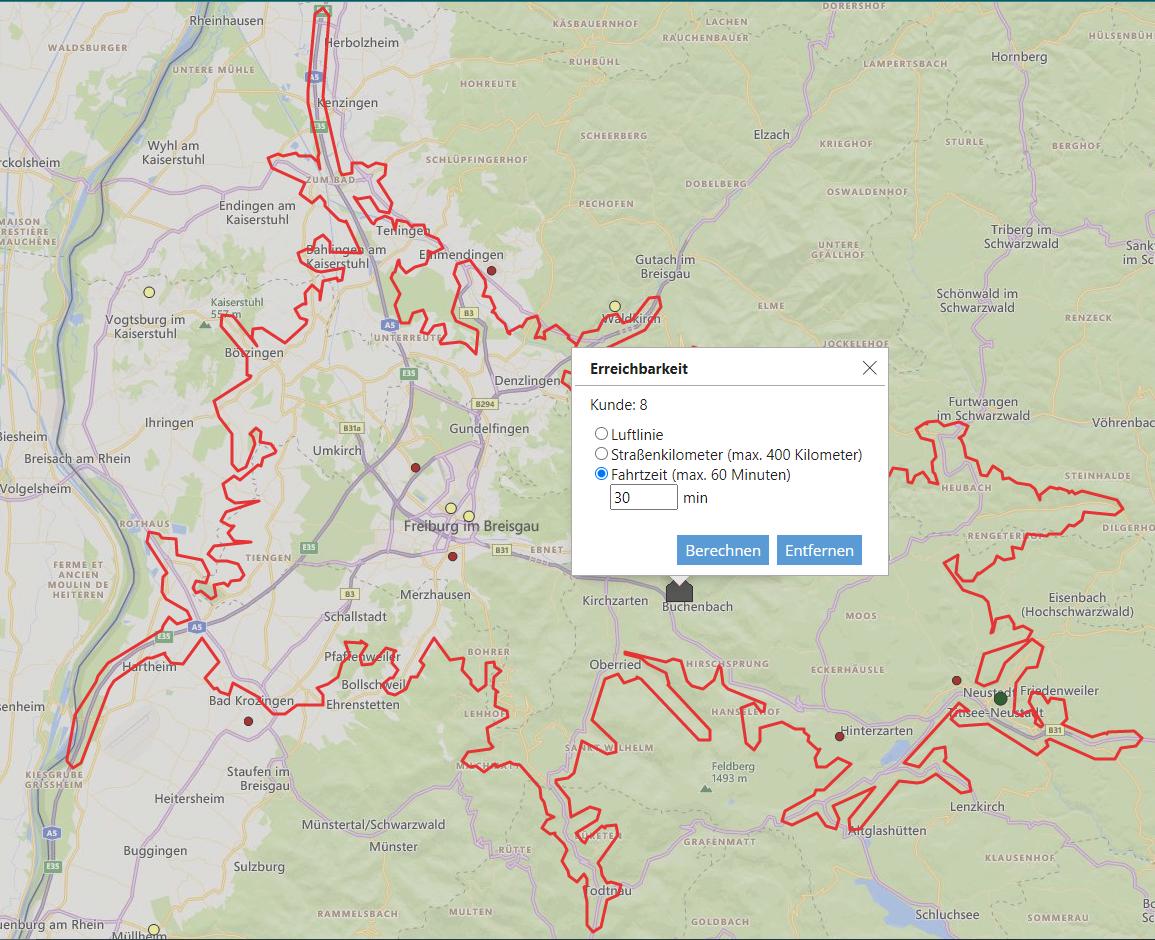
Hint: This analysis only works if the background map BingMaps street maps has been inserted in the workbook.
Hint: Territory locations are by default under the base map. Right-click to remove them from the base map and define them as a separate layer. The predefined table does not allow data display, so the data table must be changed at table selection, data display enabled if needed, and "On click (highlighted)" set.
Hint: This feature is only available if you have purchased the easymap explorer pro extension. For more information, contact us.
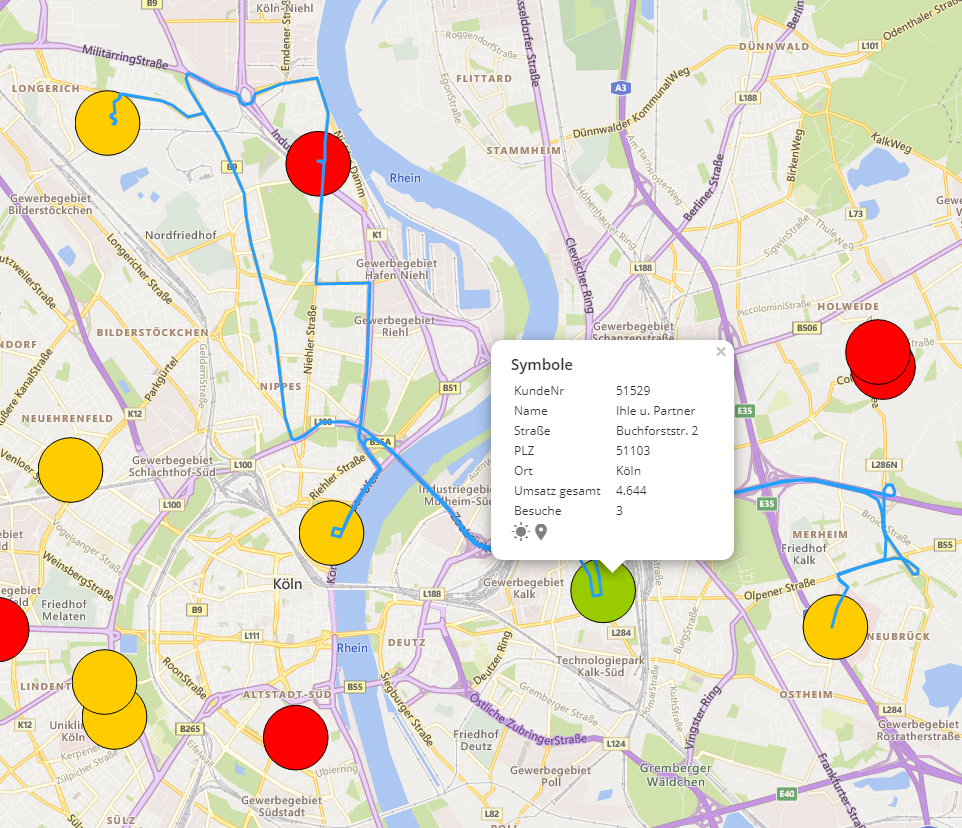
This function allows you to create and calculate a route with stopovers directly in easymap explorer. You have the possibility to define different start and destination locations. All available location-based analyses, territory locations and map layers (e.g. the areas of the 5-digit postcodes) are available as start and destination locations.
You can activate this function when sharing in the advanced settings of the map in the submenu Additional functions. By clicking on Available functions you open the dialog for the additional functions. Click on the box to enable or disable the function. Here you can make settings as to which territory locations, symbol analysis or map layer are taken into account for the route calculation.
Hint: Territory locations are by default under the base map. Right-click to remove them from the base map and define them as a separate layer. The predefined table does not allow data display, so the data table must be changed at table selection, data display enabled if needed, and "On click (highlighted)" set.
| Selection start/end of a route | Specifies which locations, symbol analysis or map layer should be the start or end location of the route. |
| Column selection |
Under the pencil you set for the start and end location of the route which information from the data is displayed as a designation in the route calculation window. |
| Selection of locations | Select which locations, symbol analysis or map layer are considered for the route stopover. |
| Column selection | With a click on the pencil icon button you open the column selection. Here you can determine for the stopovers which information from the data is displayed in the route calculation window as a label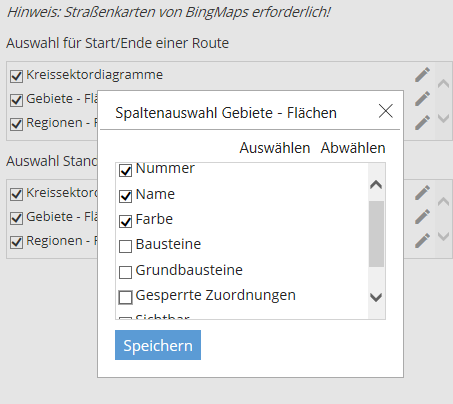 . . |
Hint: This analysis only works if the background map BingMaps street maps has been inserted in the workbook.
Hint: This feature is only available if you have purchased the easymap explorer pro extension. For more information, contact us.
