Content

|
In the content window you can select which map and which contents and analyses should be displayed on the map. |
Maps
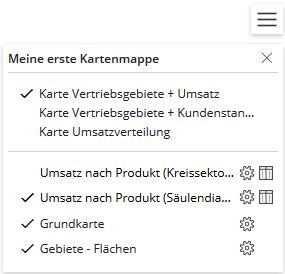
If multiple maps from a (fehlender oder ungültiger Codeausschnitt)-workbook are uploaded to easymap explorer, they will be selectable at the top of the content window. The check mark in front of the map name indicates which map is currently visible. The names of the individual maps as well as the section "Maps and Topics" can be changed while sharing in easymap explorer. If only one map has been uploaded in the workbook in easymap explorer, this area is not visible.
Contents and analyses on the map
Below the map area, all available map layers and analyses of the selected map are displayed. You can make the layer visible or invisible by placing or removing the check mark in front of the respective layer. The layers of the map can be re-sorted by drag&drop. When you mouse over a map layer, three dots appear indicating that you can move this layer with the left mouse button pressed down.

|
For analyses and the base map, the Transparency can be set with a slider after clicking the Display Settings symbol. |

|
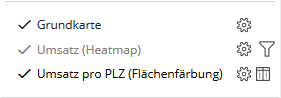
This icon opens a Table for the corresponding analysis or area. Filters can be set in the tables and applied to the map. More about Tables and filters. |

|
If this button appears next to the layer, you can only Filters. More about Filter without table. |
If the name of an analysis in the list appears in gray, this analysis is not visible in the map at the current zoom level. The name of an analysis appears in black letters in the list if the analysis is visible at all zoom levels or as soon as a zoom level is reached by Zoom-In or Zoom-Out, in which the analysis is visible in the map.
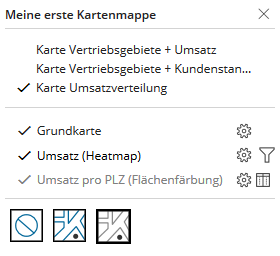
background maps
Background maps are optionally provided by the creator of the maps. You can choose between different map styles (e.g. road map, aerial photograph) or switch off the background map.
Reports
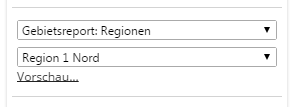
If a workbook contains Reports (e.g. area reports, filter reports) these are also displayed in the content area. There you can switch between the reports (if more than one) and the individual sheets of the report output.
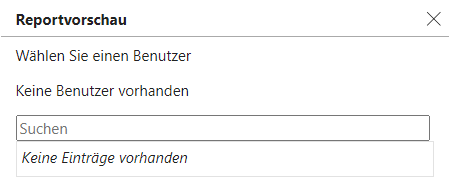
By clicking Preview, you can search the list by the name of the sales representative and directly see how the user sees the territory, depending on their permissions.
 >
> 
Hint: Area reports are usually used in easymap explorer to control permissions in order to allow certain people to view only a certain section of a map. If the workbook contains one or more reports, it depends on your permissions whether you are allowed to open the workbook and which sheets you are allowed to view. This is controlled by the reports in easymap and via report management in easymap explorer (for more on this, see Access rules and Report access).
If you have permission to edit a workbook (e.g. the creator), you can use Preview to test which part of a workbook is displayed to a certain viewer within the report.
